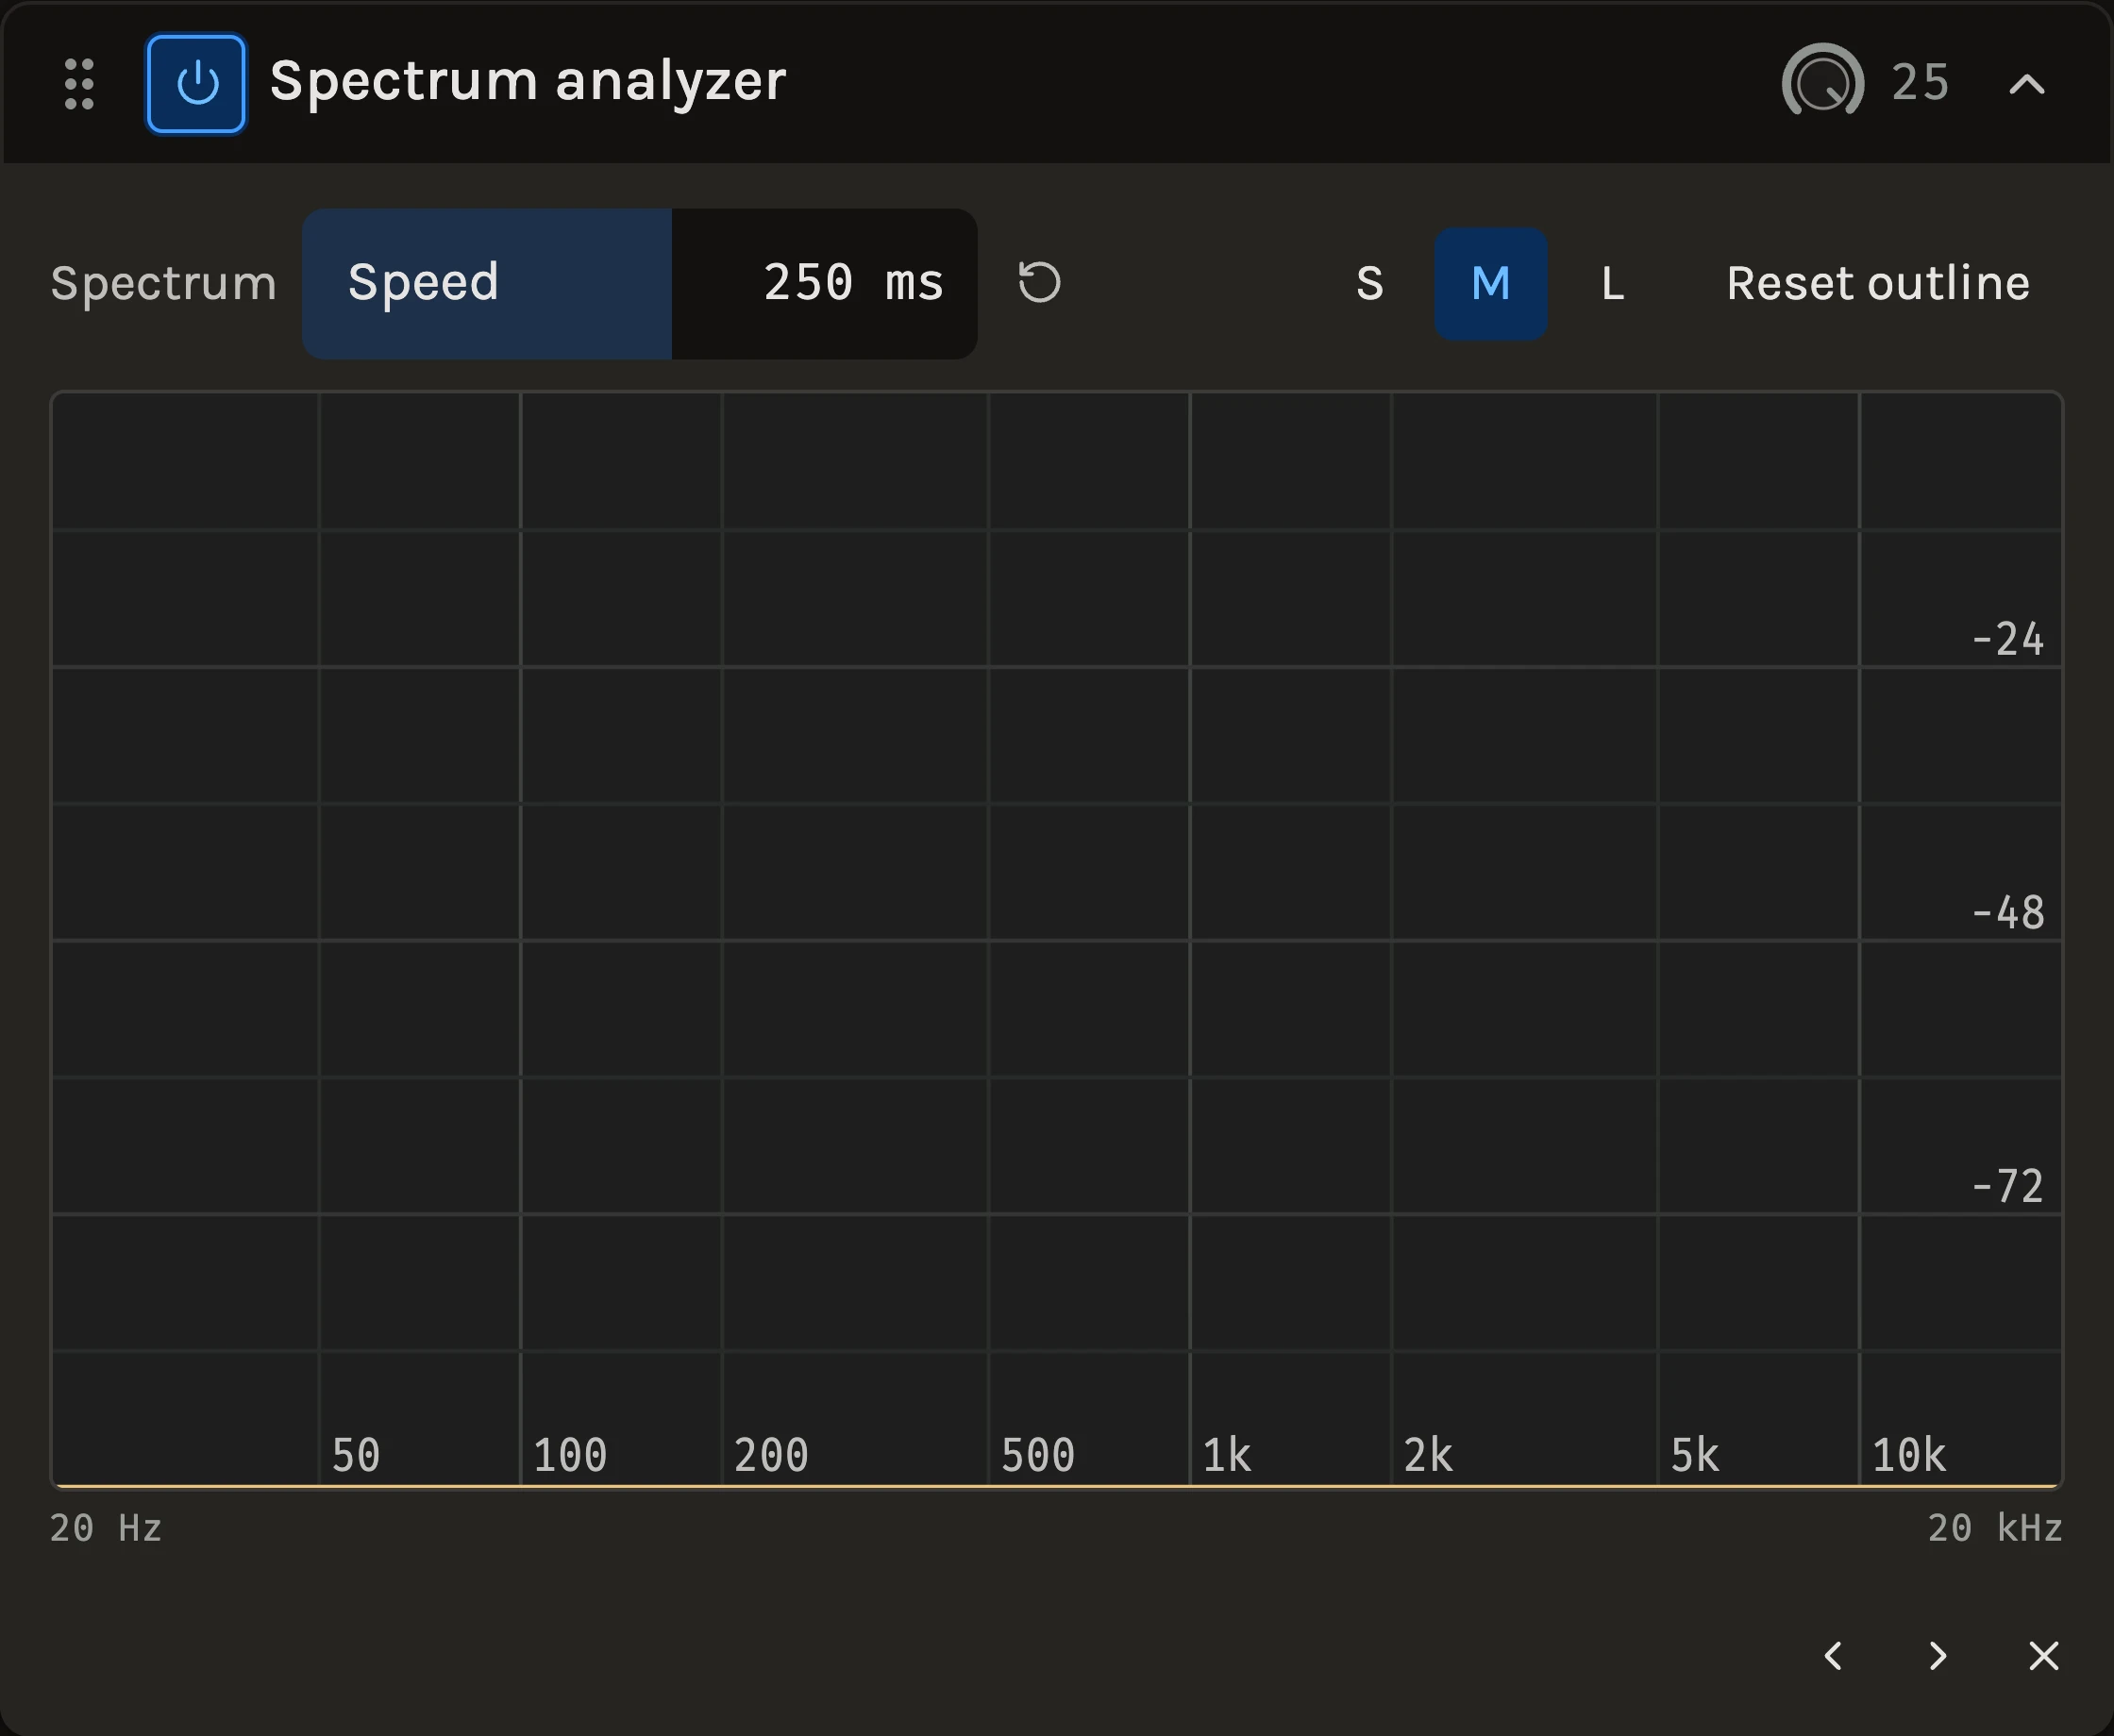
The Spectrum analyzer draws the frequency content of a sound at one point in the chain, from 20 Hz to 20 kHz, as a filled shape that rises instantly and falls at a speed you choose. A second line holds the highest level each frequency has reached since you last reset it, so a few bars of playback build up a picture of what the part actually occupies. Like the Meter it changes nothing and is left out of rendering.
When to use it
Put it after an EQ to see what the curve did, on a bass and a kick to see where they overlap, or at the end of the Master to compare the balance of your mix with a reference track in the single-file editor. Hover anywhere on the graph for the frequency under the pointer with its current and peak level. For the level in numbers use the Meter; to act on what you see, reach for the Parametric EQ.
Controls
Speed
How quickly the fill falls after a peak: 60 dB over the chosen time, from 20 ms to 2 seconds. Short is lively and follows every hit; long smooths toward an average that is easier to compare between sections. 250 ms is the default.
Size
S, M and L set the width of the card and the height of the graph. Choose a large size when the analyzer is the thing you are looking at and a small one when it sits in a long chain.
Reset outline
Clears the accumulated peak line. Switching files or restarting playback also starts it fresh.
Tips
- Set a long Speed and play the chorus twice: the outline is then the part’s footprint, and a gap or a pile-up in it tells you where to EQ.
- A full-scale sine reads 0 dB in its band, so the scale is comparable between tracks; the fill follows the louder channel.
- Narrow peaks stay visible even where the display bands are wide, so a resonance that the Resonance suppressor would catch shows here as a spike that never moves.
All control ranges 1 controls
| Control | Range |
|---|---|
| Speed | 20 to 2000 ms |
Keep shaping your sound.
There’s a whole rack to explore.